We made a query 600 times faster in the first part. Then, we optimized it more in the second part, making it 36000 times faster. In this third chapter, we analyze plan stability and try to squeeze more performance from SQL Server. Please read those articles to understand this part.
We successfully optimized a query in the previous parts. However, plan stability is as much important as raw performance. I tested the query with some random parameters. How it behaves if I make the date boundaries wider so the server has to read more data? We often see the SQL Server switch to a different plan, and it is possible that we eventually fall back to the original bad plan in the first article.
The client told me the query becomes slow when they run it for newer data and small data ranges. We have to separate this statement into two parts because they have different consequences for the plan SQL Server chooses.
If the date range is small, SQL Server probably chooses an index seek in a well-indexed database. For wider ranges, it might feel it has to select so many rows that a nonclustered index plus a lookup is not worth considering, so it switches to a scan. This kind of plan switching can be very painful for large tables. If the supporting indexes cover the query, then no lookup is needed. This is our case after the second part of the article. Therefore, we can expect our plan will be stable.
The other claim is that the query is slow despite the fact the data range is small, while they query recent data that is more interesting. This is a common issue with monotonically changing (generally increasing) values. Identity or sequence (or client-side hilo) generated integers and current date stamped DateTime columns are the most vulnerable to this problem. The source of the problem is missing statistics for the new data. I don’t write about this issue here; you can read this article to understand the problem well.
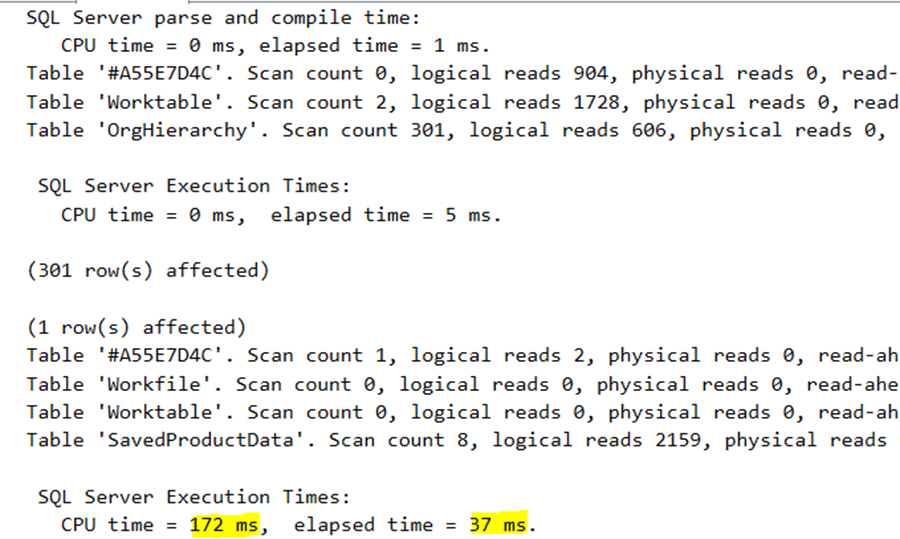
Ok, now let’s make our hands dirty again. Test our queries in the current phase with 22 years of data (which actually covers all rows):
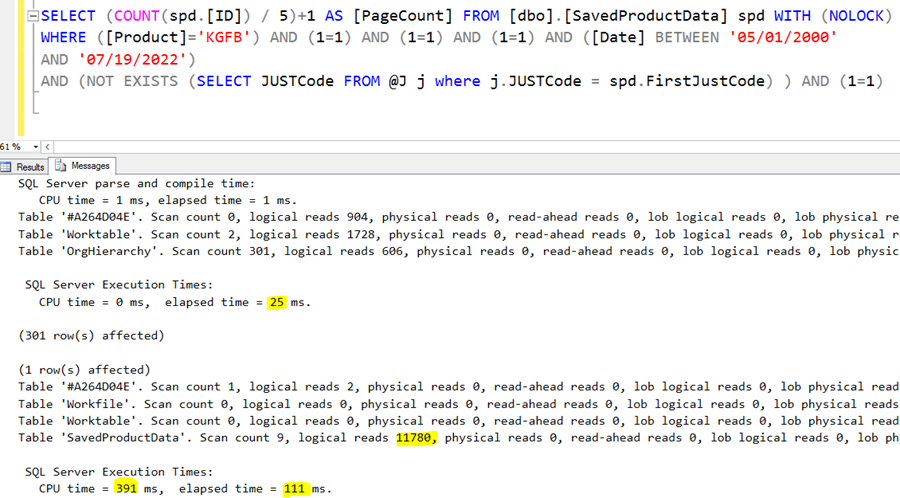
The second query returns 76000 rows (not visible in the picture). The IO was 11780, which is not small but reasonable for so many rows. The sum duration of the two queries is 136ms, which is very good considering the number of rows processed.
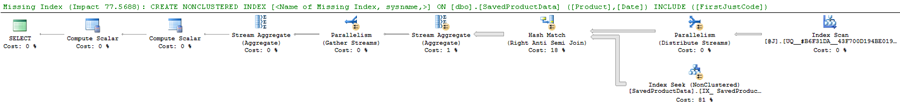
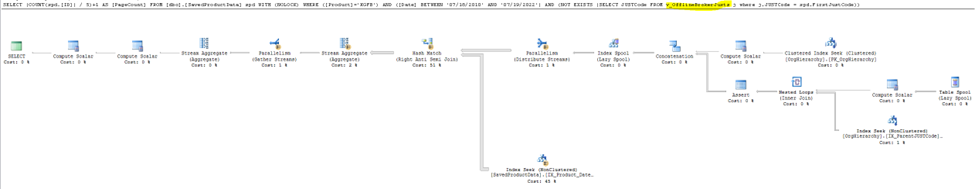
Here is the execution plan for the wide date range:
The yellow arrows suggest this is a parallel plan. Actually, this was not a surprise. If you look back to the runtime statistics image, the CPU time was 391ms, while the actual execution (wall clock) time was 111ms only. It means SQL Server probably used 4 cores to execute this query.
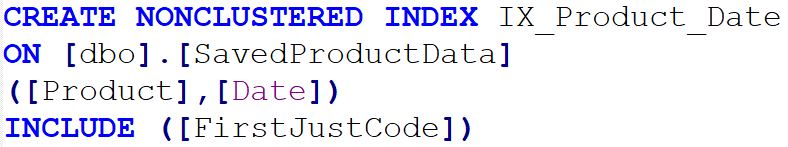
The green text indicates an index that might improve this query’s performance. I didn’t find a similar existing index that could be bent to the suggested index, so I created a new one:
We can test how it changes the execution time:
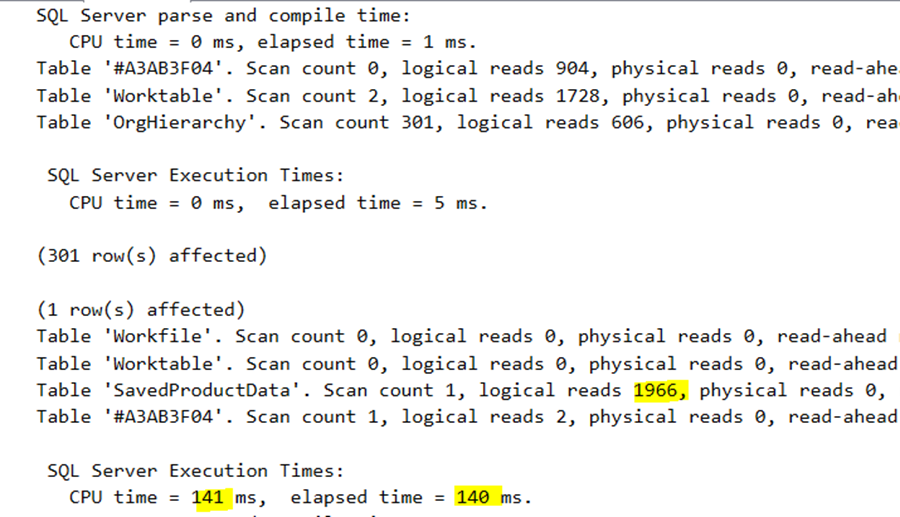
The IO on the central table reduced dramatically from 11780 to 1966. SQL Server gave us a good index suggestion. The execution time becomes a bit larger from 111ms to 140ms. But, and this is a big but, the CPU time equals the elapsed time. It means this new plan is serial. Consider this as a tradeoff. We consume 141ms precious SQL Server CPU instead of 391ms, but the query becomes a bit slower. I would be happy to accept the second one because most SQL Server database is heavily used by many users, so we have to evaluate the CPU usage carefully.
I checked the plan’s details and saw that the optimizer stopped with StatementOptmEarlyAbortReason GoodEnoughPlanFound. This is another good sign that this plan will be stable.
Thinking about the query itself
We have seen the query is a bit unusual and contains many 1=1 predicates:
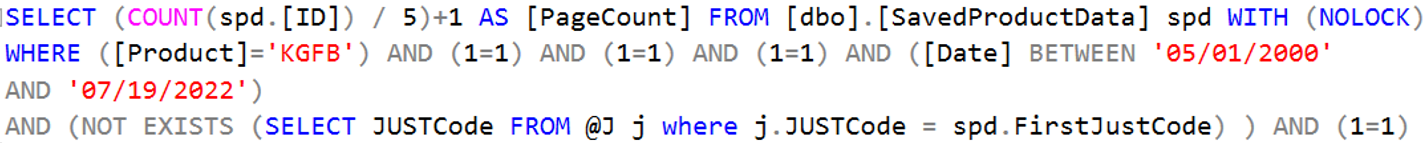
When developers filter to many conditions, they like to replace the filter predicate with a constant true expression when that filter is not used. Here the product and the date are the real filters; the other three filters are replaced with a dummy boolean true expression.
This is not a good practice!
SQL Server does not like such strange queries, and the optimizer cannot always find out that those 1=1-s are just meaningless noise. It is better to make the C# code that generates this query a bit more sophisticated and generate the real filters only.
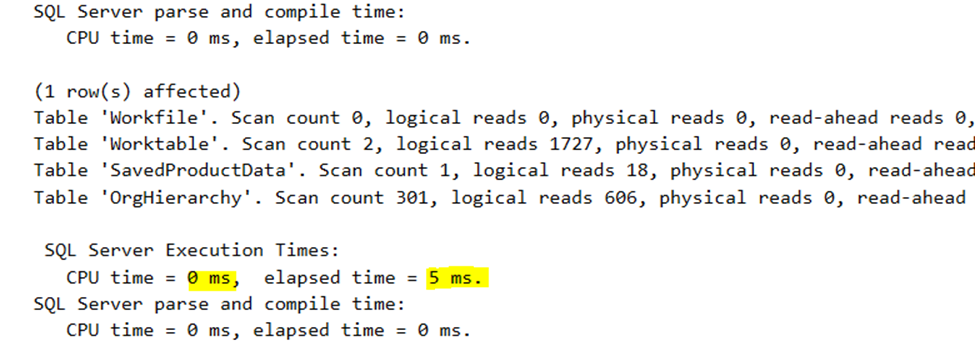
I can simulate this manually by removing the extra conditions. Executing the query again, we see improved numbers (I tested with a wide date range again):
Surprisingly, the execution time was reduced to 37ms from the original 111ms. The plan used 172/37=4.67, at least 5 CPUs (probably 6 or 8, I never saw an odd number of threads). Here is the plan:

And we see it used 8 cores:

Testing with narrow data ranges, the plan became serial again.
Eliminating the temp table
Now that the underlying tables are adequately indexed AND the query is clean, we could try to “inline” the temp table to the second query. Unfortunately, I did not create a screenshot of this query, but it is the original query rewritten to NOT EXISTS and stripped the 1=1-s from it. But I captured the execution plan of it:
The right part contains the recursive query, which was executed many times in the original query. Now, a Hash join drives it, so we can be sure it is executed only once. The SQL batch now contains 1 query again because we don’t need the temp table anymore.
Running it with the original scenario with narrow date ranges, we see the following performance numbers:
Well, this is freaking good. The final execution time is 5ms. Remember, the original query runs for 255000ms.
This is a 255000/5=51000 times gain!
The IO is nice, a bit more than 2000 pages. And you have to realize that the 5ms execution time covers the data transfer and processing of SQL Server Management Studio. The actual CPU used by the SQL Server was less than 1 ms; that’s why you see CPU time = 0 ms in the picture. This query is exceptionally efficient.
You might intervene that ok, but what about broader data ranges? Here are the results for 20 years’ date range:
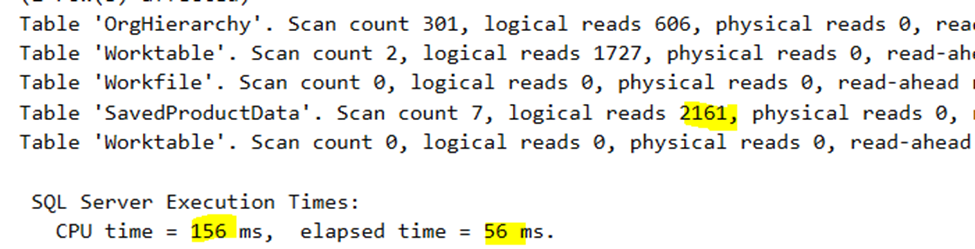
The execution time is 56ms, similar to the one with the temp table. The 156ms CPU is also very similar. Again, this is a parallel plan; we can deduce it from the numbers alone. Probably 4 cores were used.
So, we can conclude that this plan is stable; it can work optimally for narrow and wide date ranges.
Naturally, we have to examine which other filter combinations are used frequently, so we can create additional indexes to support them if needed.
Key takeaways
The simpler a query, the better the chance that SQL Server will find an optimal plan.
Sometimes the optimizer has terrible choices, like using nested loop join to drive a sub-part of the plan crazy. We must find a way to shepherd the optimizer in a good direction.
A nice-looking code is a joy for the human readers and the SQL Server optimizer. :)
Could you hire me? Contact me if you like what I’ve done in this article and think I can create value for your company with my skills.
LEAVE A COMMENT
1 COMMENTS