One of my clients struggled with the following query:
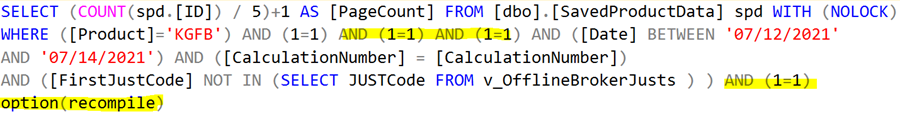
SELECT (COUNT(spd.[ID]) / 5)+1 AS [PageCount] FROM [dbo].[SavedProductData] spd WITH (NOLOCK)
WHERE ([Product]='KGFB') AND (1=1) AND (1=1) AND (1=1) AND ([Date] BETWEEN '07/12/2021'
AND '07/14/2021') AND ([CalculationNumber] = [CalculationNumber])
AND ([FirstJustCode] NOT IN (SELECT JUSTCode FROM v_OfflineBrokerJusts ) ) AND (1=1)
Sometimes it was fast, and sometimes it was slow. It seemed the query performance depended upon the input data parameter. The parameter is inside the query as a string literal (07/12/2021 and 07/14/2021).
I got a realistic-sized database for my tests. The first run was very slow:
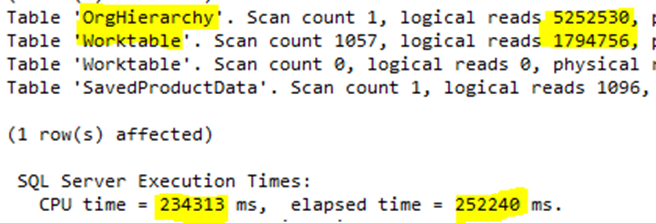
The actual duration of the query was 252240 ms, i.e., more than 4 minutes. It returned a few dozen rows; therefore, it is considered slow. I could test it with several date combinations to check which one yields fast results. But I wanted to see a stable plan first, so I investigated why this particular plan was so heavy.
When a query contains “bool logic” filters for optional filter predicates like this one, I like to run it with the option(recompile) hint to see whether applying it helps create a better plan. (I’ll write about the reasoning behind this in a future article.) If it does, the mission is accomplished, the author will append that query hint to the end of the original query, and we have finished the optimization. Let’s try it:
Performance-wise nothing changed. The query execution remains slow. We will have a more tiresome day. :)
It’s time to examine the execution plan. The IO revolves around OrgHierarchy and a Worktable. The latter one is not a user table; SQL Server uses it when it has to store some temporal data during query execution. Poorly indexed tables or inefficient plans generally contain some of them.
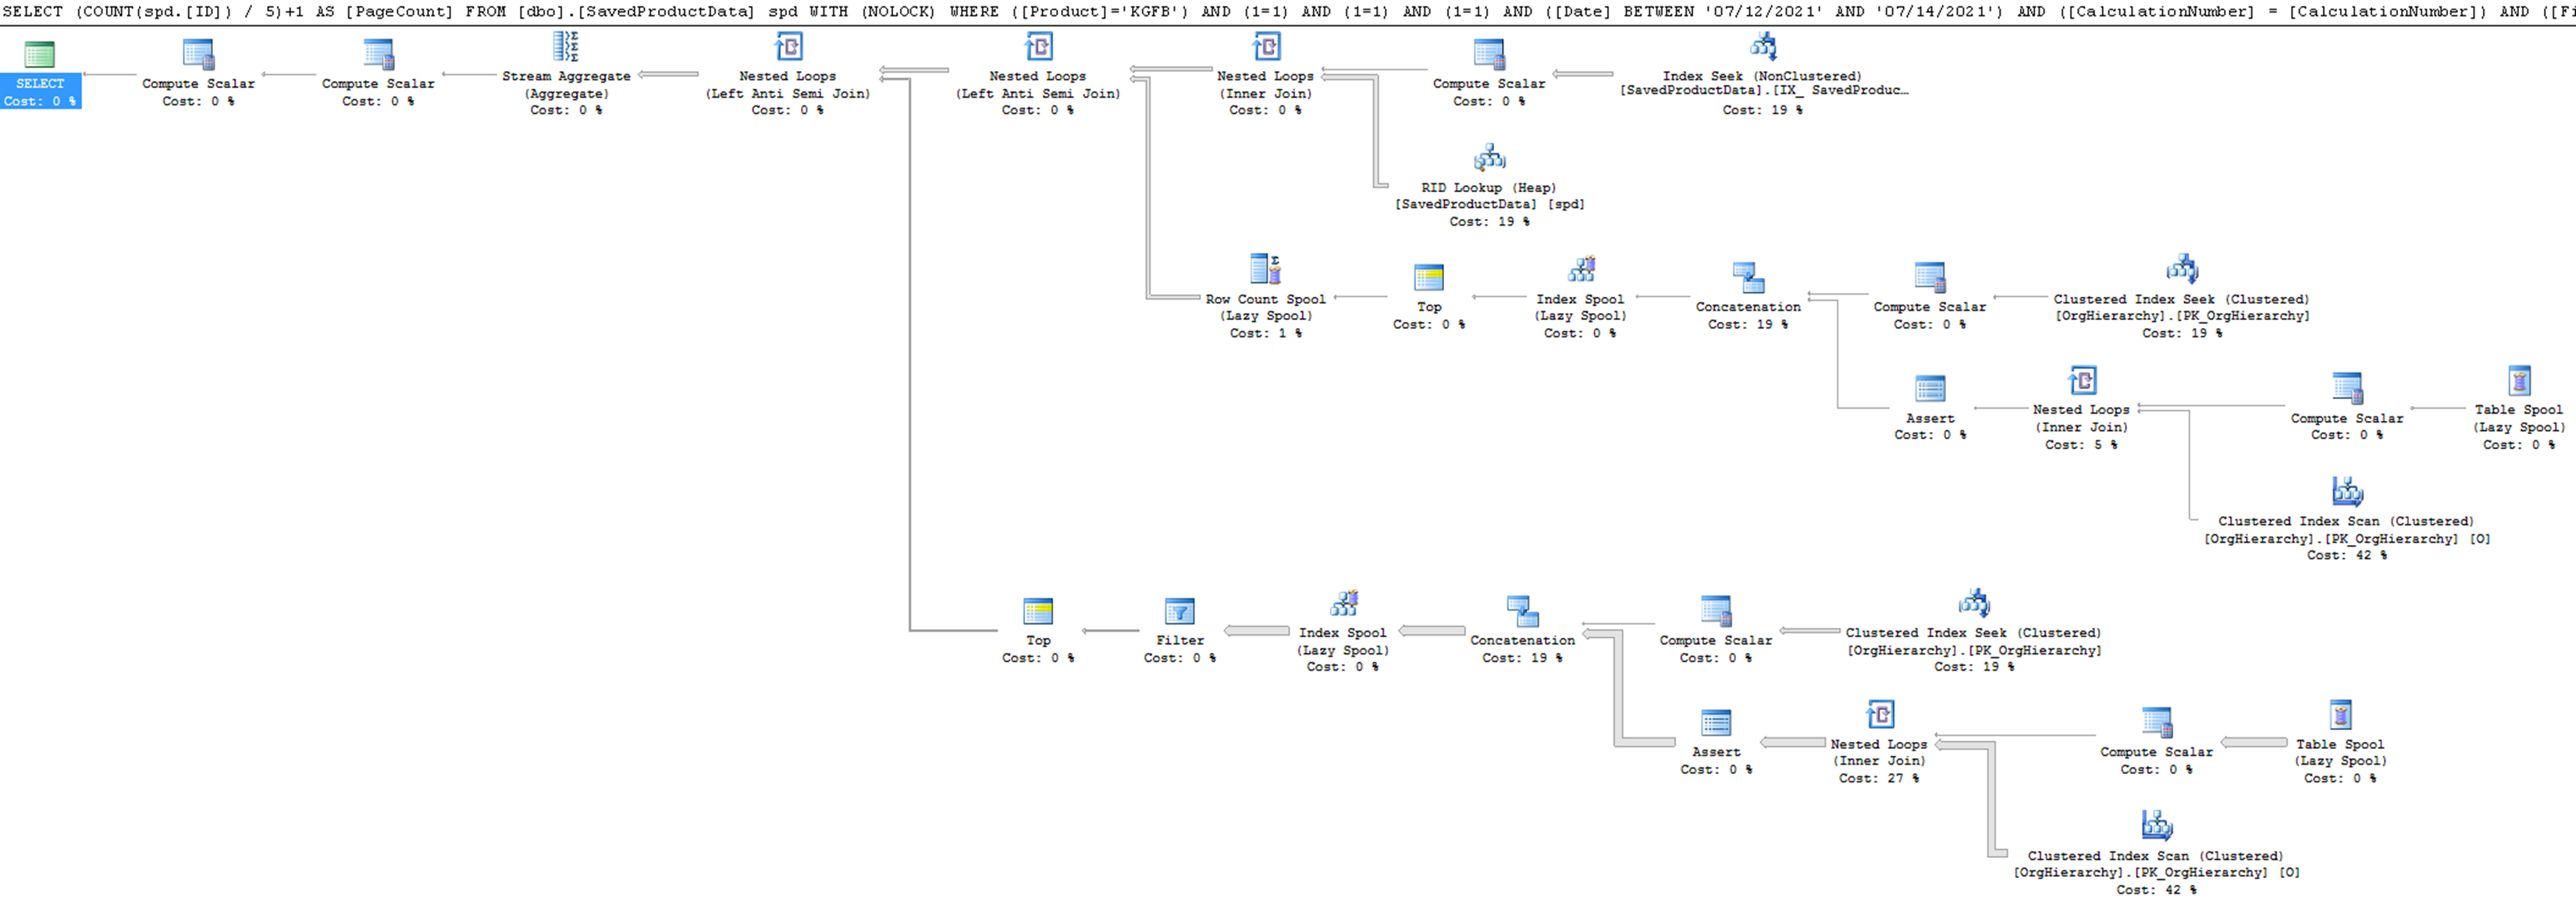
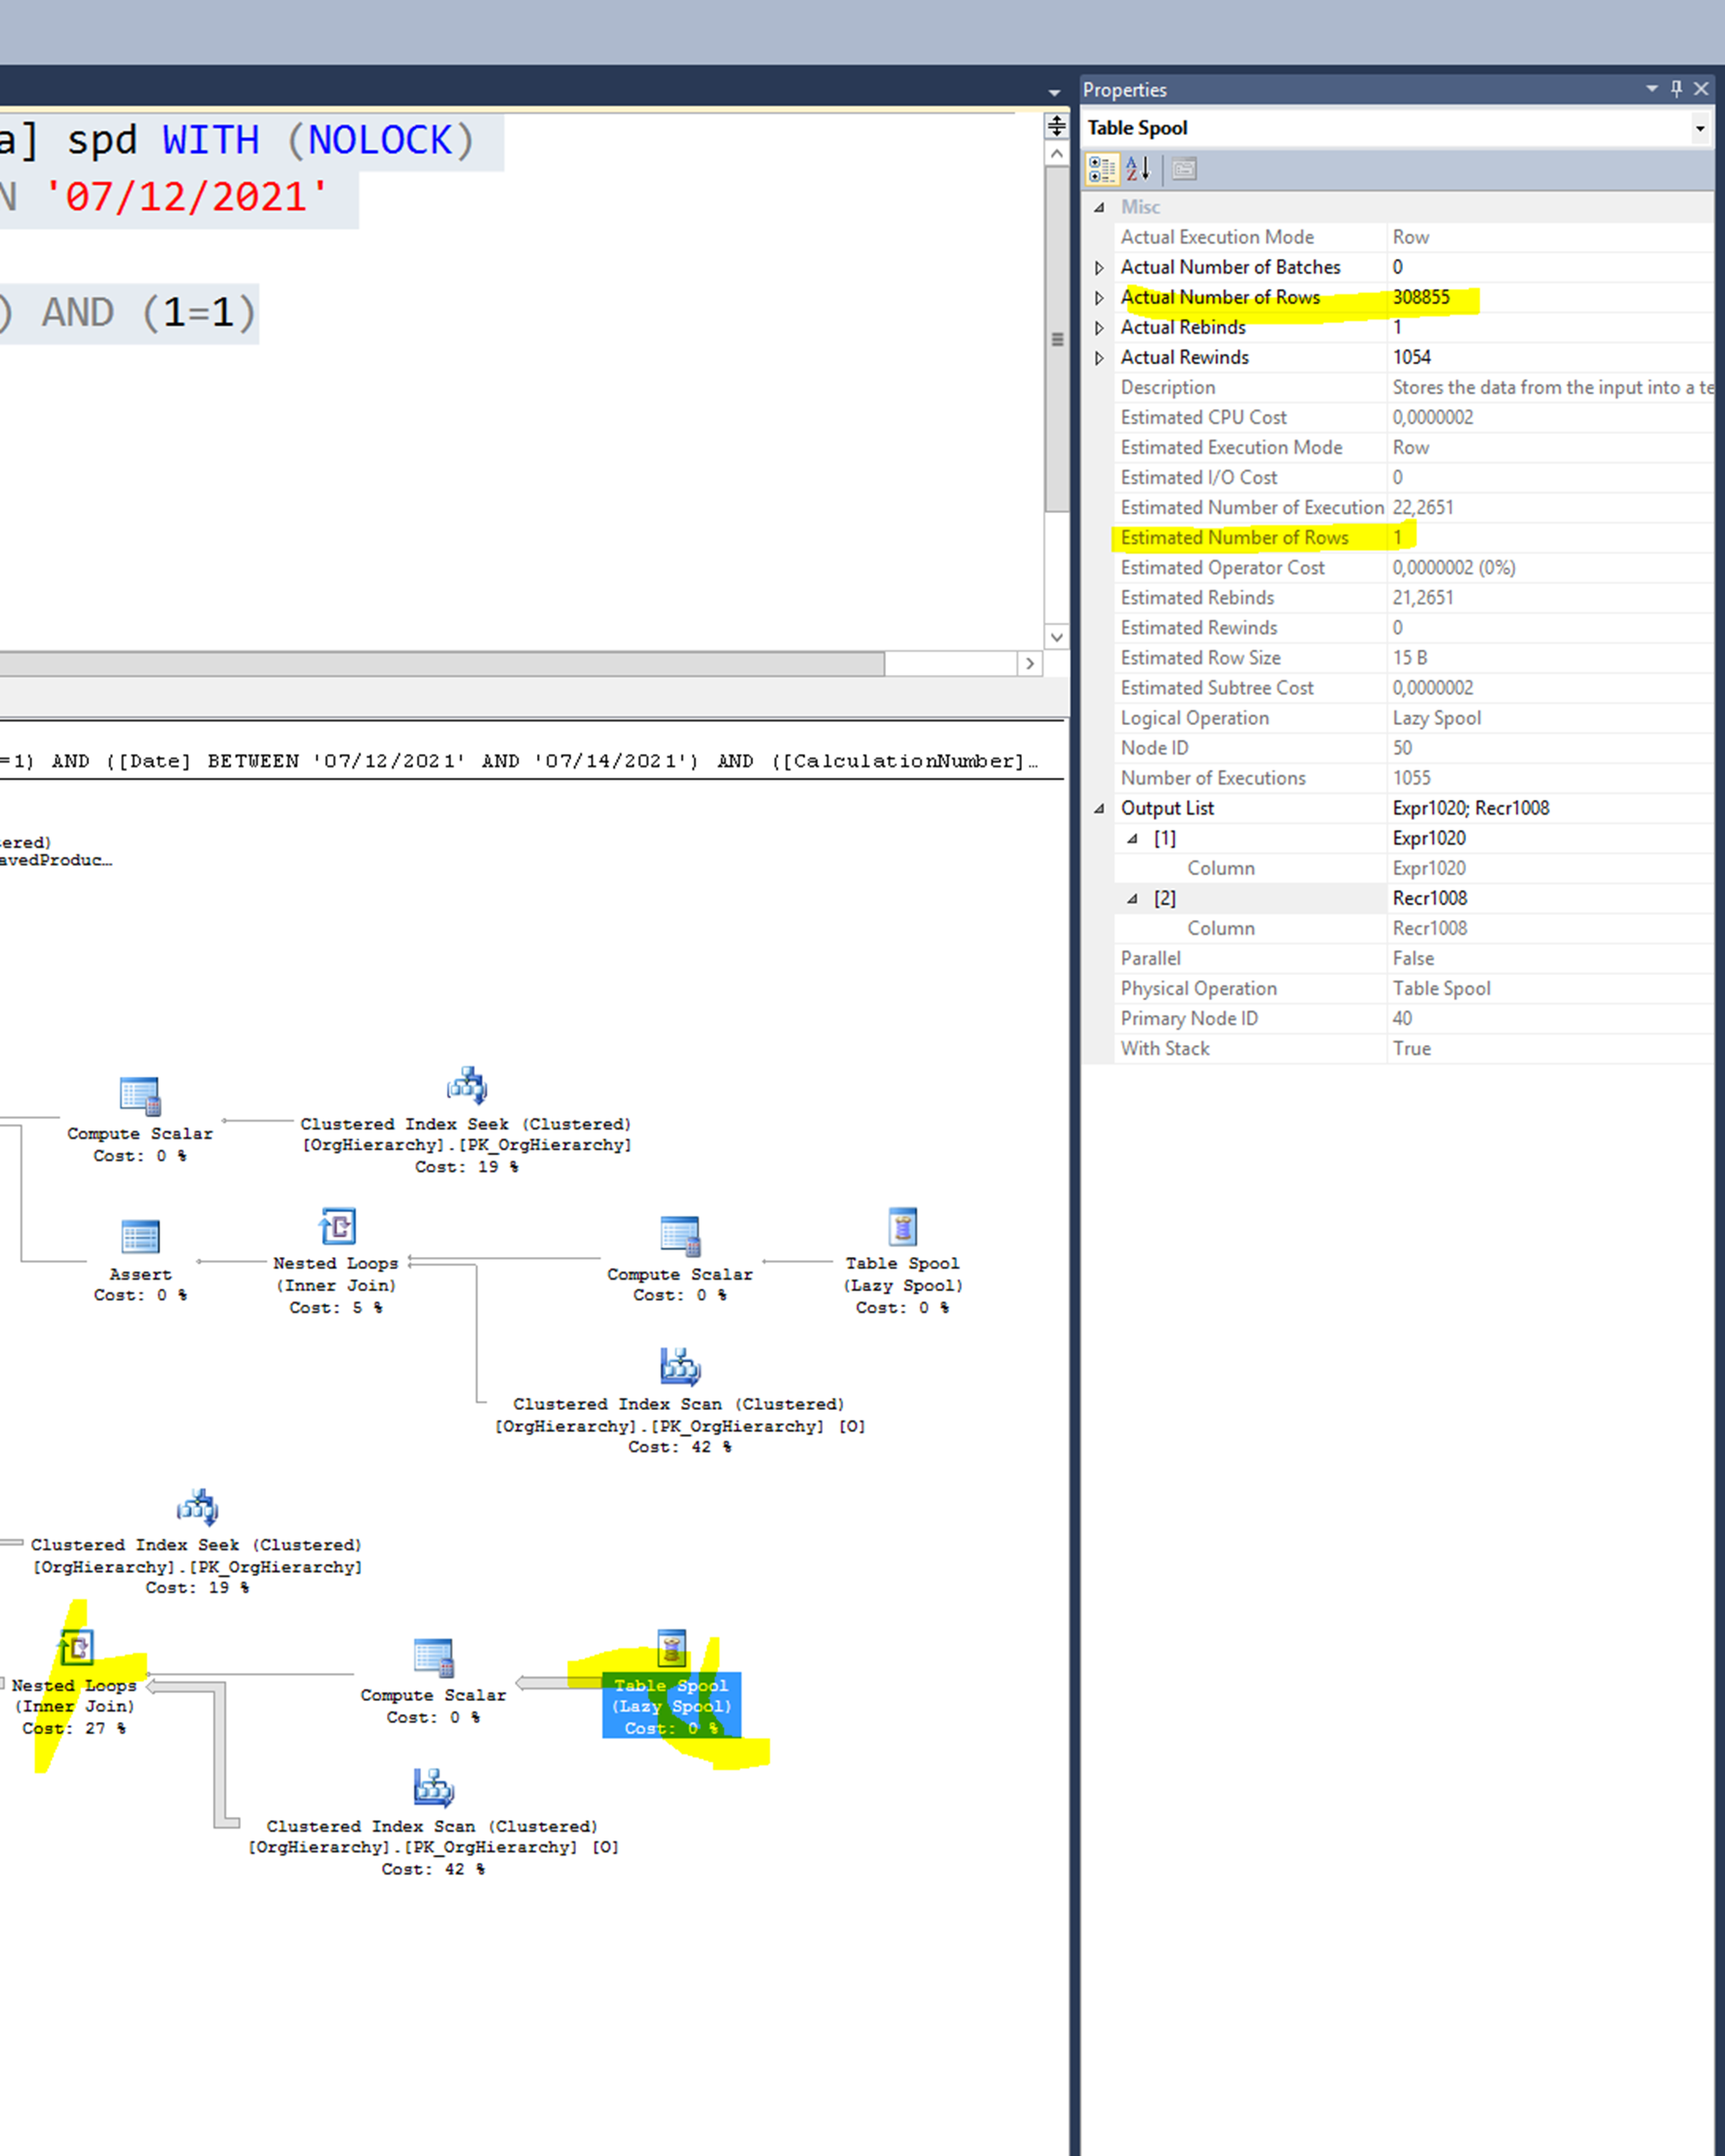
The lower-right Clustered index scan on the OrgHierarchy table has the highest cost. Let’s investigate the details of this operator:
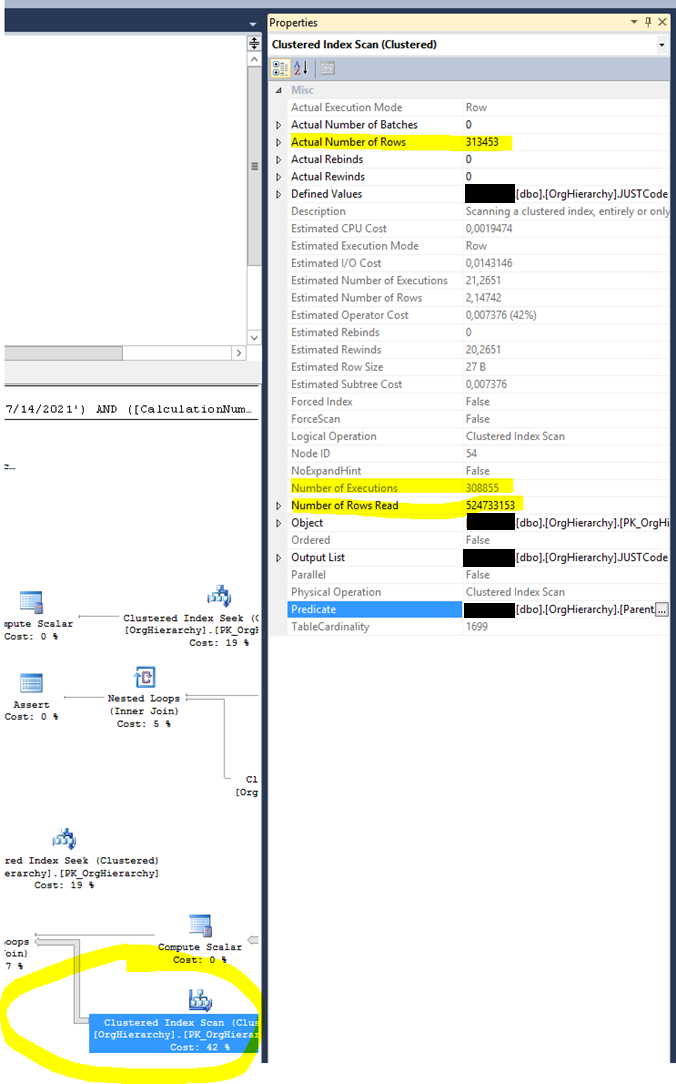
This operator is called 308,855 times and yields 524,733,153, i.e., half-billion rows! We feel this is a huge performance bottleneck.
Why does it crunch so many rows? First, it is a scan; generally, scans touch many rows (but not always). This suggests a missing index. What confirms this idea is that the rows flowing out from this operator is 313,453; however, it had to read 524,733,153 rows to produce them. And there is a Predicate (blue), which means it had to filter rows one by one (like an if statement per row).
The Estimated Number of Rows is 2.14, and the Actual Number of Rows is 313,453. This fact suggests missing or outdated statistics.
The Estimated Number of Executions az 21; in contrast, the (Actual) Number of Executions is 308855. We cannot blame this operator for it. It is called as many times as the operator at the left directs. It is just suffering from its neighbor. However, the two numbers mismatch indicates poor statistics of other tables.
In the following picture, you see a Table Spool operator is the data source of a Nested Loop Join, so now it is evident why the Clustered Index Scan operator is called so many times. The Estimated and the Actual Number of rows for the Table Spool operator is very bogus. They are 1 vs. 308855. Statistics, statistics.
The data source of the Eager Pool is equivalent to the following query:
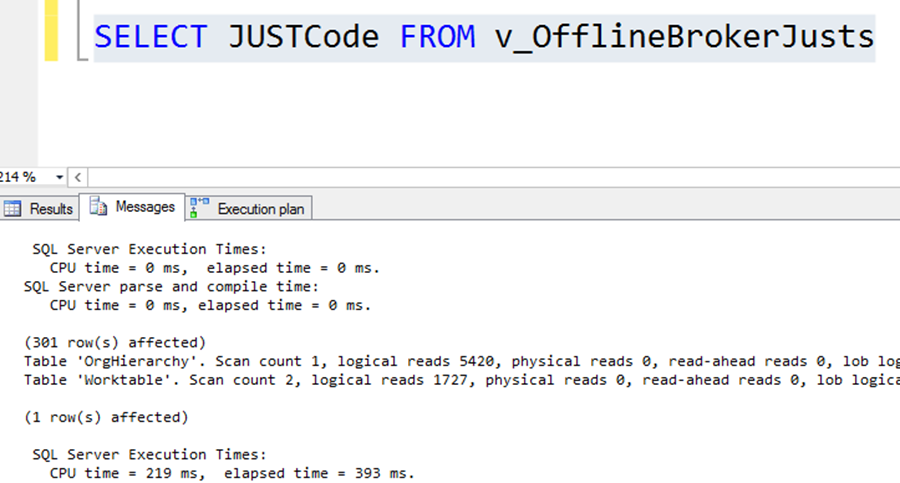
We can imagine the Eager Pool as a temp table filled by the previous query automatically. The number of rows is 301, which is not too much. The logical reads are reasonable, and the execution time is 393ms, which is also acceptable. So, this query alone is not bad at all.
What is inside the v_OfflineBrokerJusts view?
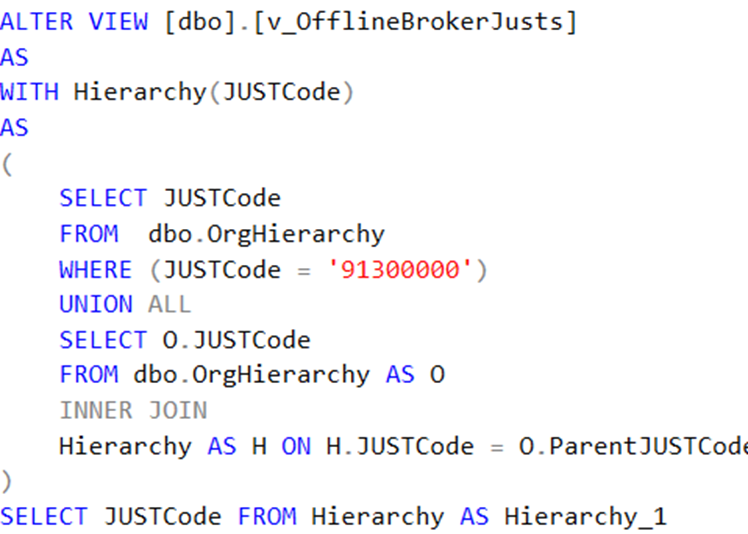
This is a neat recursive query. The recursive nature justifies some thousand reads we saw in the stats, recursive queries are not the fastest ones, but we love them for their functionality. We are fortunate enough that it is used in the examined query non-correlated manner. I.e., it is called once and only once. Just recheck the initial query:
SELECT (COUNT(spd.[ID]) / 5)+1 AS [PageCount] FROM [dbo].[SavedProductData] spd WITH (NOLOCK)
WHERE ([Product]='KGFB') AND (1=1) AND (1=1) AND (1=1) AND ([Date] BETWEEN '07/12/2021'
AND '07/14/2021') AND ([CalculationNumber] = [CalculationNumber])
AND ([FirstJustCode] NOT IN (SELECT JUSTCode FROM v_OfflineBrokerJusts ) ) AND (1=1)
The NOT IN part does not correlate with the “head” query, so SQL Server should have executed it only once. At least the logic dictates this claim. However, SQL Server decided to execute this sucker 308,855 times. Poor Eager Spool! (And poor my client.)
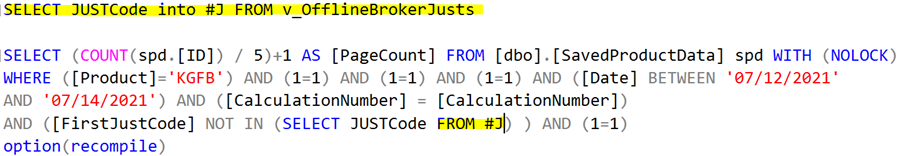
Because SQL Server did not understand that the Table Spool should run once, I tried to help it by materializing the content manually to a temp table. Then SQL Server might create a better plan.
Warning: creating a temp table for each plan problem is NOT a good practice. I have seen many slow queries because the creators split the query into several parts and manually materialized the parts of it to temp tables. This lessens the degree of freedom of the SQL Server and generally achieves slower performance.
Ok, after this disclaimer, we materialize that subquery and compose it into the original query:
Executing it gives the following result:
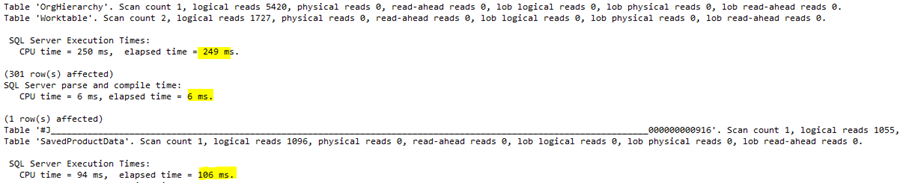
Creating the temp table needs 249ms, recompiling the query forced by the option(recompile) hint is 6ms, and the rewritten query runs for 106ms. Much-much better. The sum execution time is 249+6+106=361ms. The baseline was 252000ms. Therefore, the gain is 252000/361=698-fold.
We could stop here and call it a day. However, why did SQL Server create a very inefficient plan? I will investigate that in the upcoming article.
Spoiler alert. The final execution time will be 10ms. 250000ms/10ms=25000x gain. Stay tuned.
Could you hire me? Contact me if you like what I’ve done in this article and think I can create value for your company with my skills.
LEAVE A COMMENT
3 COMMENTS
Szép. A végrehajtás során a performancia szempontjából a sorrend nagyon-nagyon nem mindegy.