Read the article, and I reveal the exact gain I made. :)
This week I worked on two optimization tasks. They were so fascinating I even spent some part of my nights programming them because I could not sleep; I was too excited.
The more interesting one was a report which ran initially for 3 hours. It starts every night at 01:35 and generally finishes between 04 AM and 05 AM. However, sometimes it ran over 08:00 in the morning, so the stakeholders could not see the business results and felt uncomfortable. And they projected this feeling to the programmers. :)
My task was to speed up this report as much as possible. I initially suggested a 5 minutes goal, but this was just a funny guess because I did not know the details yet.
I won’t document the failed attempts and side cases, just the changes which progressed the system toward better results.
Initial observations
The first information I got is SQL Server query duration history during the report generation:
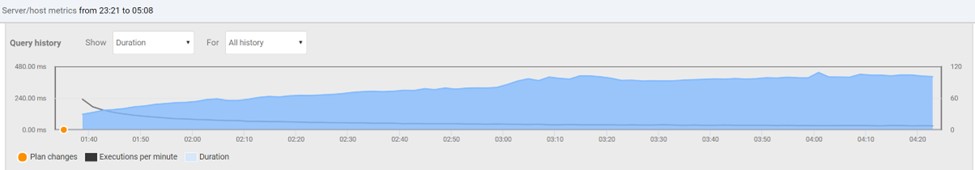
You can see from this chart that it runs many queries and the load increases as the report progress. The programmers told me they had to add pagination to the main query, which populates the report; otherwise, it never finishes. In other words, the primary query has so high cost it doesn’t finish in an acceptable time.
I’ve created an integration test to run the report without excess code. I hate driving the measurable code via web pages or other GUI. The GUI or service layer is unnecessary bloat, making testing harder.
I ran the original code version while examining the generated SQL batches. The increasing cost you see in the initial image is clearly visible:
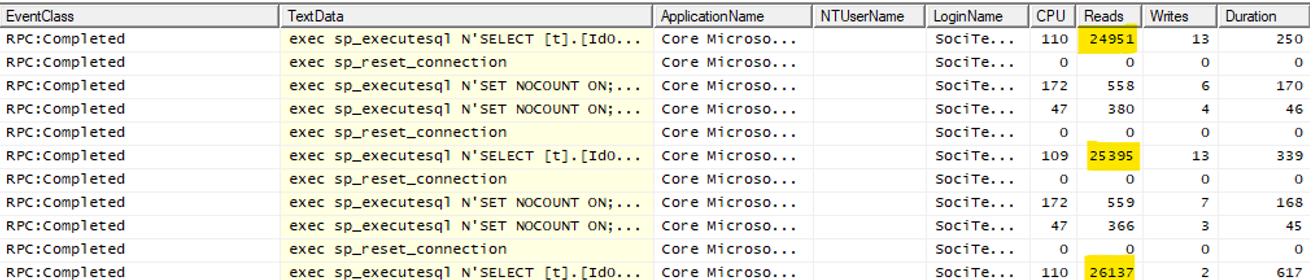
We already know this is a paging query series, so the increase in “Reads” in each iteration is expected.
Entity Framework Core generated the queries. The base LINQ query uses several .Include calls (eager loading) that yielded many left outer joins in the generated query. To make the query cost acceptable, the programmers added paging methods, Skip() and Take(). And they drove the paging in each iteration. They created a loop and got the first page of data, the second, and so on. The result set to process contained 120000 rows, so several thousand pages had to process.
My first attempt was to run the LINQ query without the paging. I simply removed the outer loop, which drove the paging, and commented out the paging methods. I started the report and watched the query in SQL Server Profiler. I saw the query in the Batch Start event but did not see it finishing. It was so slow I stopped it after some minutes of running. I tried to run the query in SQL Server Management Studio to exclude EF from the picture, but it did not finish within minutes. So, the problem was the query itself, not EF.
AsNoTracking
I checked whether the authors used AsNoTracking in the query, and they did. AsNoTracking is very important for read-only queries when you don’t plan to modify the data using the EF DbContext, which retrieved the data. AsNoTracking instructs EF NOT to create data tracking structures, so the materialization of the result set will be faster, and the memory usage of the context will be less.
The query had nine joins and read the underlying tables almost entirely. It means it processed several million rows. Generally, we can optimize such queries somewhat, but there are no miracles; they won’t run fast enough for our purposes.
When you see such a large EF query generated by many Includes, you should ask: can I project the necessary data to DTO instances instead of using the original “wide” entities? Because the report generator used several dozen fields, I did not attempt to create DTOs to contain the necessary data only. Instead, I tried another approach.
EF Split Queries
Since EF Core 5, we have a handy feature: Split Queries: “EF allows you to specify that a given LINQ query should be split into multiple SQL queries. Instead of JOINs, split queries generate an additional SQL query for each included collection navigation.”
So, instead of creating a large, all-encompassing query, EF creates a separate query for each one-to-many direction. These queries are less complex, so that we can optimize them better.
The split queries had quite reasonable running times: 327, 26, 21, 171, 32, and 225 seconds. The total data loading time was 802 seconds, which is about 13 minutes. This was a promising start.
Filtered Includes
However, the query loaded more data than we needed. The Includes unconditionally load the many sides, resulting in less than ideal loading time and using excess memory. Fortunately, EF Core allows us to limit the rows fetched by the Include methods. We can filter the rows by a Where call:

The execution time decreased a bit: 327, 24, 18, 154, 30, 72 = 625 seconds. It takes a bit more than 10 minutes. 30% gain by just some filters, not bad.
I never trust even my measurements, so I compared the queries with and without the Where calls:
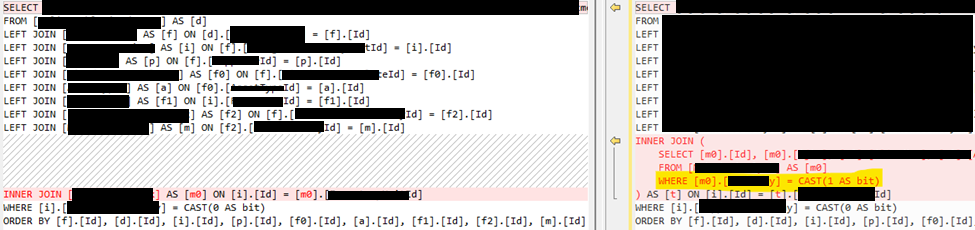
You see, EF created a virtual table that filters the base table and uses it instead of the original one. This is a well-readable and reasonable implementation.
Network performance gotchas
The next day I repeated the measurement, and the total execution time of the 6 queries generated by the EF Split query was 81 seconds! It was 625 seconds yesterday! The reason is that I turned off the Wifi adapter of my machine, so it started to use the ethernet connection. The SQL Server protocol is susceptible to the network connection’s lag because each packet expects an acknowledgment. The latency between the data access layer and the SQL Server definitely kills performance.
Ok, so the initial data querying time is perfect, 81 seconds. Let’s work on the second part, the result processing!
The report data generation was a pure in-process algorithm and very fast. It completed in 3 seconds, so I had no reason to optimize it.
Bulk insert humiliates EF batching
The final part of the report was data storage. The report generator created 120000 result objects in memory and added them to an EF DbSet. In the past, the in-memory addition of the data would result in an exponential slowing down because of the change tracking of Entity Framework. EF core does not suffer from this problem, so the 3 seconds report generation already included the time to add the objects to EF.
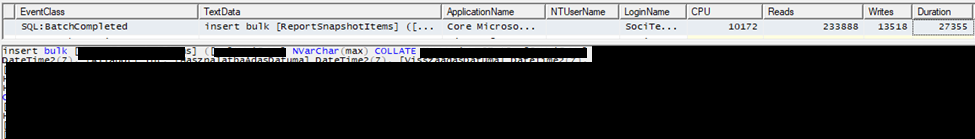
However, the EF SaveChanges call was very slow. EF is not an appropriate tool to save several thousand rows. Earlier EF versions had no batching capabilities. So, 120000 rows would need 120000 separate insert statements to execute. EF Core can group many DML statements into one batch so that it can insert more than one row in a roundtrip. This was a very awaited feature, and we missed much in EF Classic. However, appearances can be deceiving. The generated SQL has 1-2 thousand parameters, and it is very ugly. And they are not uniform, so SQL Server cannot cache their plans of them effectively. Look at this profiler picture:
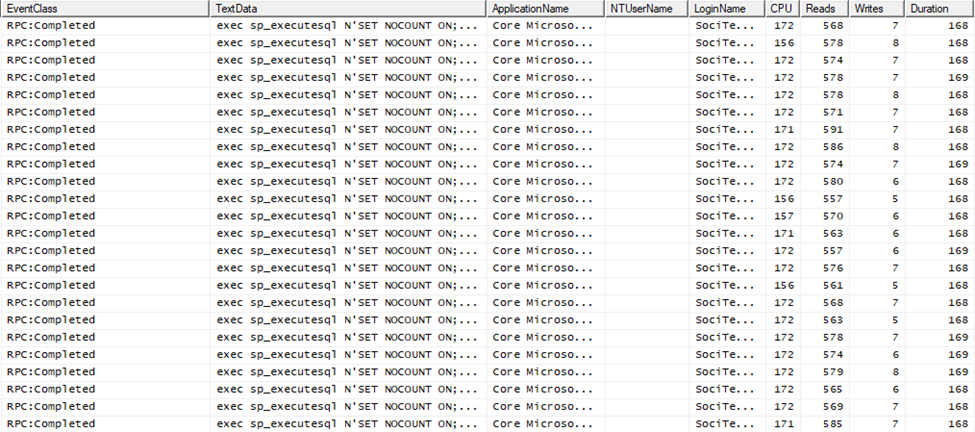
Each batch contains about 10 SQL insert statements. The execution time of a batch is about 170ms. This implies that 1 row is inserted in 17ms. This is much more than we anticipated. An ordinary insert should not spend more than 1 millisecond time executing. Then why the actual insert batch is an order of magnitude slower? It is due to the recompilation cost. As I told you, these are large, ugly ad-hoc query batches. Most of the 170ms are spent compiling the batch. And SQL Server can’t spare this time by caching the plans because the generated SQL is diverse. I hope MS will improve this aspect of EF code generation. This is such a severe problem that I had to turn off batching in another optimization work. Think about it. If a single insert takes 1ms, you can insert 10 rows in 10x1ms plus some network roundtrip overhead. If there is a good network between the EF and the SQL Server, 12ms is realistic for this scenario. So, your inserts would be more than 10 times faster without batching. This is counterintuitive; that’s why you have to know about it. Besides, SQL Server query compilation and optimization is a very CPU-intensive process, so each batch consumes about 160ms CPU time of SQL Server. Incredible waste of time of the precious SQL Server CPUs.
However, at this time, I didn’t test turning off batching. 120000 rows are simply too much to insert row by row. We need a better approach. Enter Bulk Insert.
You might know SQL Server has an alternative interface for inserting a large number of rows, and it is called bulk insert. It does not use insert statements; it is really a separate data access interface for fast row inserts. I won’t delve into the details of its internal workings and what conditions are needed to make it fast. It is enough for us that it certainly faster than standard inserts.
How can we access bulk insert in .NET? We can use the SqlBulkCopy class. It has a very minimal API. You can set the destination table name, an open SQL connection, and pass the data source data structure. It will push the data to SQL Server in a very effective way. The data source is a DataTable or IDataReader interface implementation. IDataReader is a complex interface; it is time-consuming to implement. Our data is in entity object instances, so we can copy them to a DataTable. However, we would double the size of our memory usage. A much better solution is to use the IDataReader input; it is a streaming interface, not a buffering one. We could convert the List<Something> to IDataReader. This is called the Adapter pattern in the GoF Design Patterns book. Fortunately, we don’t need to do it manually. There is an excellent nuget package called FastMember for this purpose.
FastMember nuget package
FastMember is designed to get/set fields and properties of an object by name. We could use reflection for the same purpose, but it is known to be slow. FastMember uses IL code generation, so it is very fast. It has another facility we need now, the ObjectReader class. It is a configurable adapter that can adapt an arbitrary IEnumerable<T> to IDataReader. Now you can imagine why we need this package. It can consume our list of entities and make it possible for SqlBulkCopy to read it. Here is the usage from the documentation:
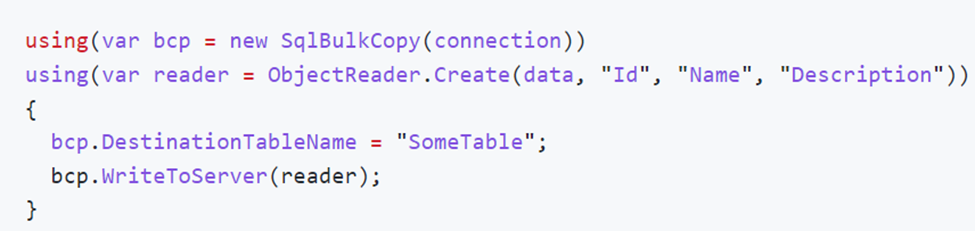
You have to supply your property name list in the order they are mapped to the destination table. If the table has an identity column like Id, you have to include it in the list, but bulk copy won’t copy its value; it will be generated in the database as usual.
So, it was easy to configure SqlBulkCopy to bulk insert 120000 entities to the database. Here is what you see in the SQL Server Profiler:
You won’t see individual inserts; you see one row only, which inserts all 120000 rows in 27 seconds! Yes, it is blazingly fast. EF would need 1-2 hours to do the same.
The remaining code of the software was fast enough, so I didn’t touch it.
Correcting nvarchar(max) columns
One remaining task was to convert the inappropriately created nvarchar(max) columns to a shorter nvarchar(something less than 4000) column. If you don’t configure a string property in EF mapping, it will map it as an nvarchar(max) column. Nvarchar(max) can store 2GB of data, but it has a significant cost. Besides, you cannot create an index on them. Both can be detrimental to your performance. I converted these blob columns to normal nvarchar(200) or similar ones.
The conversion is easy, you have to alter the column definition:
ALTER TABLE TableName ALTER COLUMN ColumnName NVARCHAR(2000) NOT NULL
Because there were several dozen bogus columns therefore, I used a simple SQL code to generate the alter statements:
select 'ALTER TABLE TableName ALTER COLUMN ' + [name] + ' NVARCHAR(4000) ' + IIF(is_nullable = 0, 'NOT NULL', 'NULL')
from sys.all_columns
where object_id = OBJECT_ID('TableName')
and user_type_id = 231
This small script will generate an alter for each nvarchar(max) column. Naturally, you must add/correct the property mapping in EF configuration so that migration can generate the alter statements for you too. Beware, these alter statements can be very slow if the table has many rows. In my case, it took 1 hour to run all alter statements. If you want to run them by migration, you might not have enough time in your maintenance window. I suggested the client run the alters manually by Management Studio or an SQL Server Agent Job at night. Then include them in EF Migrations too. When the migration runs the alter statements again, SQL Server will notice they don’t want actually to change the table, so they run instantly.
Employing Server Garbage Collector
I ran the code in a unit test, so it used the Workstation Garbage Collector flavor. This application did not use threads explicitly, but it was a modern, async code, so it used threads under the hood. Server GC can improve the application performance by not locking so many threads simultaneously because it uses separate heaps for each CPU. (The reasons are more complex, read Maoni for details.) It is worth testing your workload using Server GC. You can turn it on, for example, in the project file. Check the official documentation for the details.
By using blocking server GC, the overall performance of the report became 5% better. Not much gain, but it was free. The live code version will run under Kestrel so that it will enjoy server GC without further configuration.
Reducing latency even more
I created a small console application to run the reporting code for the final test. I published it to a folder as a framework-independent deployment, so I could run it from any server without installing .NET 6. I published the release version of the code. Do not measure debug code; it will be slower than the release code because it doesn’t contain optimization. And more importantly, it does not let the Just In Time compiler optimize the generated machine code.
I copied the report runner app to the SQL Server itself. In reality, it will run on a separate application server, but I did not have access to more servers, so I used the SQL Server computer.
Final numbers
CreateCompleteReport data retrieval by EF split queries: 00:00:33.28
CreateCompleteReport in-memory processing: 00:00:00.48
CreateCompleteReport saving 120000 rows by Bulk Insert: 00:00:03.65
Other final processing unrelated to the earlier ones: 00:00:05.18
So, the overall run time of the report becomes 00:00:45.69 seconds (some code branches are not included in the previous list).
This is 170*60/46 = 221 times gain. :)
The nightly report builder became so fast that the client could run it during the day at any time, making real-time analytics closer.
Key takeaways
One tool does not solve all data access problems. We love EF Core, but we have to use it properly (Split Query, Filtered Include, AsNoTracking, projection to DTO, etc.). And we have to know where are the limits of EF and replace it with a more specialized technique like bulk insert. If you combine the appropriate tools, you can achieve superior performance and a greener world.
Could you hire me? Contact me if you like what I’ve done in this article and think I can create value for your company with my skills.
LEAVE A COMMENT
4 COMMENTS
Szép volt megint !
Vajon milyen érzés lehet a túloldalon lévőknél ? Valami ilyesmit képzelek el:
“Csináltunk valamit ami éveken át ment, 3+ órán keresztül generálta a riportot és úgy tűnt hogy ez így jó.
Most jött valaki, átírogatott benne ezt-azt, és 3 óra helyett 1 perc alatt kész lett ugyanaz. Mi ennyire buták lennénk ?”
Mindenki felfogja, hogy azért hívnak, hogy segítsek nekik. Ezt eddig mindig észrevették az ügyfelek, és tanulni akartak, hogy ők is hasonló eredményeket érjenek el.
Tök ugyanezeket a cuccokat használom én is, amikor kódot kell optimalizálni. Az elmúlt 5 évben rengeteg hasonló problémát kellett megoldani pl 800 000 sort memóriába pakolni( jobban mondva kiszedni onnan) , nvarchar maxokat atirni, de a legjobb amikor wherebe in-t küldenek 10000 értékkel :/
A Where .. IN gyakori. Pár elemre jó is az, de sok sorra megabájtos lesz az SQL. Volt már, amit magam írtam át IN-re, mert a temp változóban átadott változó számú paraméter miatt tempdb torlódás lett. Annyi volt az elegáns megoldásnak, maradt az IN.