I have done many-many, very interesting .NET and SQL Server optimization work in the past 20 years. Actually, this is the most fascinating consulting task I do. In the following months I plan to dig into my past documentations, and compile them into articles. Every optimization is unique, but there are repeating patterns which help me find out the root causes of the problem and the solution for it. I try to emphasize them in the documents, so it can be better generalized for future cases.
The system to optimize consists of a .NET Core MVC Web Service Layer and a VUE frontend. It is a typical rich client “line of business” web application. There are several dozen data grids written in TypeScript, which show data from the service endpoints. The data is pageable, custom filterable, orderable, this is also very common among LOB applications.
Part of the requirements is to be able to export the data which is visible on the datagrid to excel and pdf reports. The exported data should be the same as the data presented in the grid, the same ordering and filters should be applied. The only difference is, the grid pages the data, the exported reports present all data. If there are 1500 filtered rows, the grid will show 20 per page, but the report should contain all 1500 items.
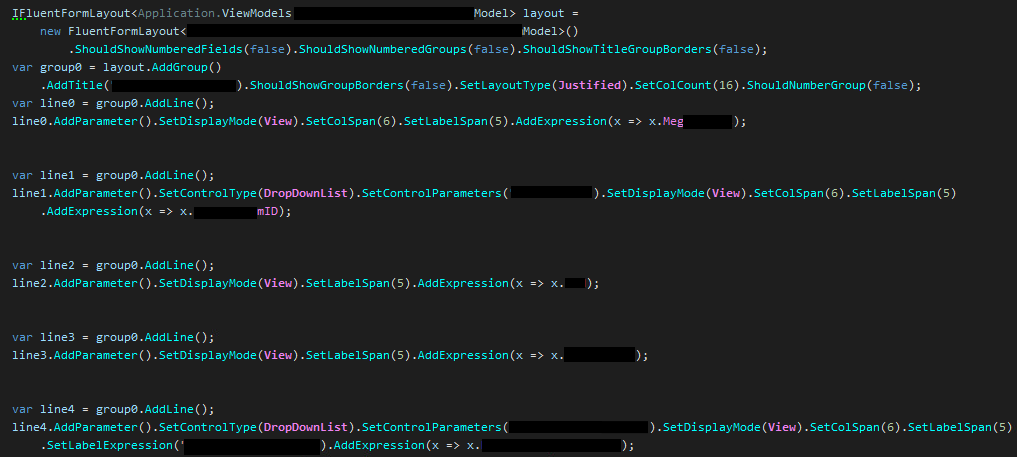
Each screen has a report descriptor for the Excel output, a short pdf output and a large pdf output. The last one mimics the editor form layout of the data entry screens. The reports were described by a complex proprietary xml format with repeaters, sections, nesting, etc. One of my tasks was to create a C#, strongly typed, fluent syntax report description, and to convert the xml files to this new format. I won’t delve into the details of the report description, just show it for completeness (I hid company specific words).
The report needs a data source. For DRY code we reuse the data access code of the datagrids. This has the advantage that we don’t have to write the data access code twice, and the disadvantage that more data is queried than necessary for the report (the report might not contain all data the screen does). Based on pragmatic considerations (financial and required performance) we only create specific report-tailored data access code for demanding reports which load the database excessively.
The reports contain lots of labels which are localizable. This is again a very common requirement of a LOB application to be able to localize every string and image visible on the GUI and in any output like reports. The localization lookup, which resolves a string from a resource name should be extremely fast, because it is used very heavily. A report can easily contain several thousands of localizable content, so lookup performance is essential.
Let’s document my findings in chronological order.
I got a realistic database with masked data which preserved the distribution of the original data. This is important, because it is common problem to test an app on 10 rows, and to be surprised to see that it does not work on 1 million rows.
Generally, I start SQL Server Profiler or Extended Events Profiler at the beginning of the test because I like to see what SQL statements the application has generated. I use SQL Server Profiler for local database profiling when the overhead of the measurement is not an issue. For live application monitoring I use XE Profiler. Simply watching the profiler output while the application works tells me a lot about the quality of the data access code.
First, I filtered 319 rows from the total 94385 in the datagrid, then I started the detailed pdf report. When you measure the performance of an application there are multiple possible measuring points: the execution time of the queries, the execution time of .NET methods, and the total response time of the system. Because the end user does not care about the implementation details, the most direct way to judge the performance of the application is by the response time the customer experiences. In this case the easiest way is to use the browser developer tool Network Tab, where you can see the total response time of the service api which generates the pdf. (The client-side code behind the GUI might spend more time consuming the response, but in this case it does not, so measuring the XHR response time is appropriate.)
The duration of the pdf generation was 42 seconds. This is quite a lot for 319 items. To be fair, each item has lots of nested data, an item is more than 4 pages long in the report. Nonetheless, it needs optimization.
For optimization jobs I ask the client to specify what the expected performance of the system is. I might not able to achieve that number, but at least we know the reason we cannot reach it, and what can we do if it is critical to achieve that performance.
In this case the 319 rows is close to the maximum the client expects to export to pdf. The report for this data set has 1380 pages. The users would kill all trees on the Earth if they decided to print it. :)
So, we agreed that we wouldn’t let the users export more than 400 rows. For the 319 test rows a 30 seconds execution time is acceptable, of course the less the better.
The initial execution time was 42 seconds. Not too far from the minimum requirement, but we have to consider that the SQL Server was on the same machine as the Web Service. Intra-machine communication uses shared memory which is faster than a real network communication. Another fact is one server on the live system handles several hundred users simultaneously, so the actual performance is expected to be worse. Sometimes even 10 times, we know from experience.
The database was hit by 5453 queries. We feel this is rather excessive. It’s about 17 queries per item. This is more commonly seen in LOB applications than you might think. The most common reason is that someone creates data access code for 1 item, then others reuse it in a loop pumping by ids from a head query. This is somewhat acceptable in memory but can ruin databases with many users.
Consulting with the developers it turned out, they actually queried all of the necessary data at the beginning of the data access code, but they thought the related, nested data was not loaded, so they reloaded related data for each subitem of each item. After realizing this, we were able to remove the unnecessary code.
The modified data access code sent 20 queries to the database, and the total execution time of the queries was about 2.5 seconds. Which means we don’t have to spend more time on data access (yet), because it is an order of magnitude faster than the whole process, so we don’t gain much by tuning the queries.
Here are the main numbers for the actually executed queries:
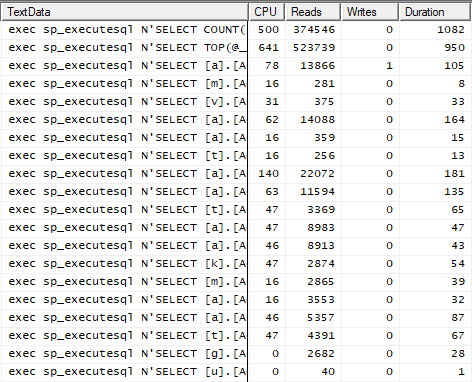
The first query will disappear later. The second one has quite high IO (Reads), but it was a conscious decision to use forced nested loop joins in the view which is queried in the first and the second line. It makes Reads high, but this plan was the most appropriate for this scenario with very different number of rows in the different tenants. The remaining queries are quite ok.
Here are the measured execution times at this stage:
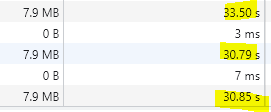
These numbers are measured by the browser, so these are the real durations the customer experiences. Coming from more than 40 seconds this is quite good progress. And, as a very nice side effect we only send 20 queries to the SQL Server instead of 5453.
Now, I suspected most of the time is spent inside the actual pdf generator code. But by my original qualification I’m an Electrical Engineer, so I believe nothing unless I measure it myself. It is time to use a .NET profiler.
Visual Studio has a built-in profiler, but I like JetBrains DotTrace more. The GUI and the logic of it are simply better suited to my taste. Naturally, if I can’t use it, I’m ok with VS Profiler too.
Generally, I start profiling an application in Sampling mode. It has low overhead, so the measured numbers deviate no more than 10% from the real duration measured without the profiler. It cannot answer questions such as how many times a method is called, or which line has the longest duration. But when a code is not optimized explicitly like I do it now, it has so large inefficiencies that they are clearly visible even in Sampling mode.
Here is the first Profiler measurement of the report generation:
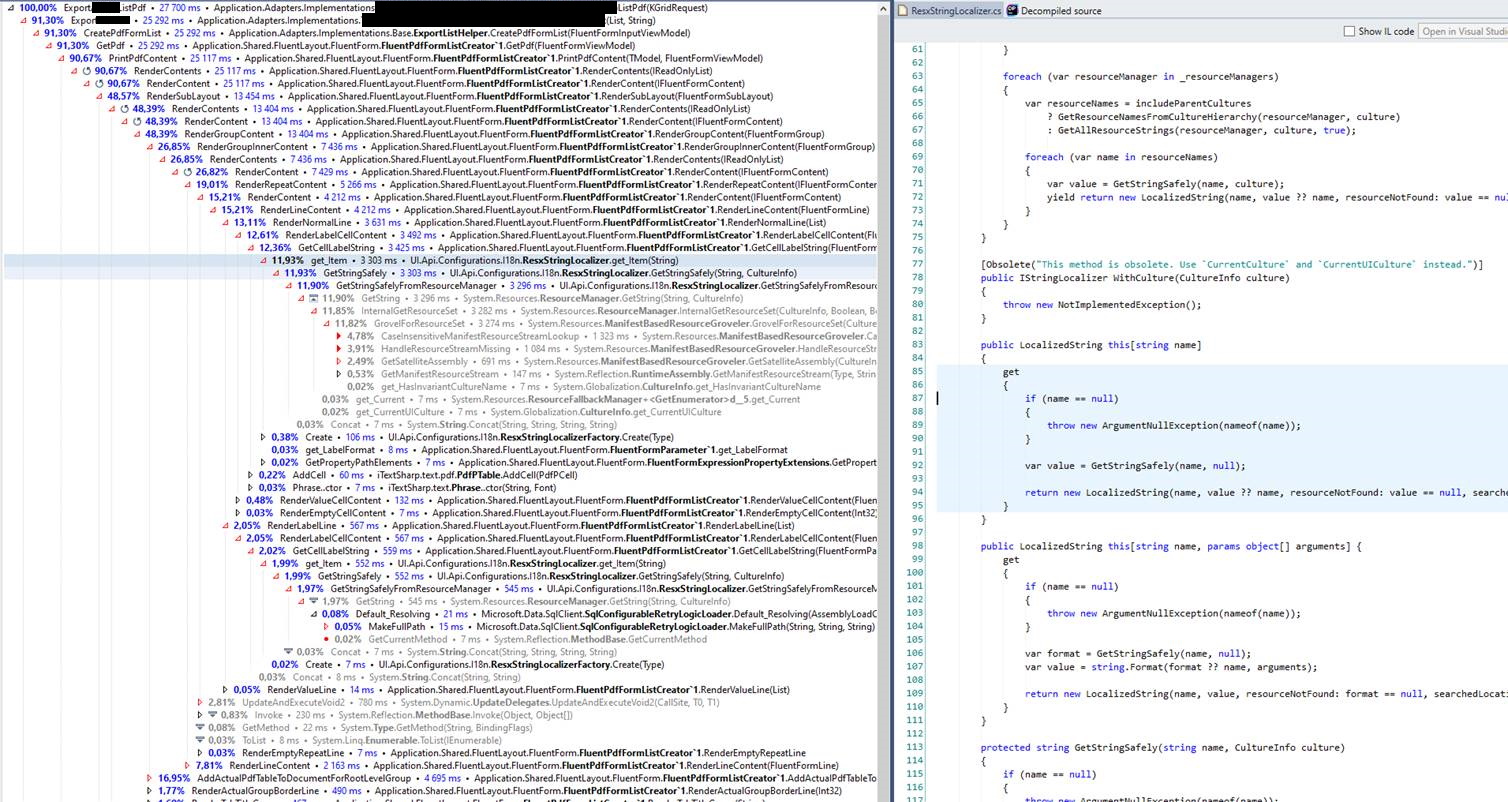
The service method total execution time was 27.7 seconds. Because the user experienced 31 seconds response time, it means the remaining 3 seconds is the overhead of the network communication (the output pdf size is 7.9MByte).
It was surprising to see ResxStringLocalizer calls took 3.3 seconds. This is just one call path for this method, but DotTrace allows us to aggregate the duration of all calls to one tree. Here it is:
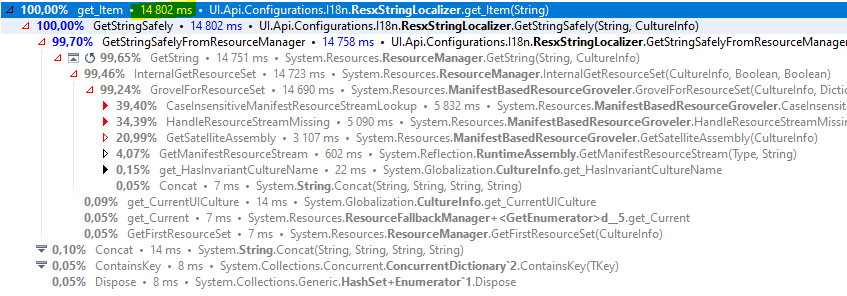
Wow, the localization took almost 15 seconds! This is very unexpected result. Remember, the whole pdf generation took 31 seconds, and half of it spent in the localization code. I know from experience, that it should be lightning fast.
When I see such a large inefficiency, I feel happy, because then a large gain is expected. If the localization cost would be 0, the execution time would decrease from 31 seconds to about 15 seconds.
Why is the localization is so slow? We see the time spent in .NET framework code, so we don’t have to find out why it is so slow, it is the responsibility of Microsoft developers. We have to find a way to work around it.
The essence of the localization is just a simple lookup based on 3 parameters: the resource name, the resource set which contains the localized resource and a culture. This is a 3-part key. We can cache the answers to the queried keys, so we can amortize the slow calls to the real resource manager. For caching a finite, not too big number of items some kind of Dictionary is appropriate. However, this is a service code which is multithreaded, so a thread safe approach is needed. A ConcurrentDictionary would suffice.
When programmers face the multiple keys challenge, they generally create a unique key by string concatenation. They combine the three pieces of the key by separating them by some arbitrary separator like:
string key = $"{name}_{resManagerName}_{CultureName}";
This is not a sophisticated approach. First, the string concatenation needs some CPU cycles. Second, it creates lots of memory garbage. The localization code is called several thousand times per second in the real environment, so we don’t want to generate memory pressure by ineffective practices.
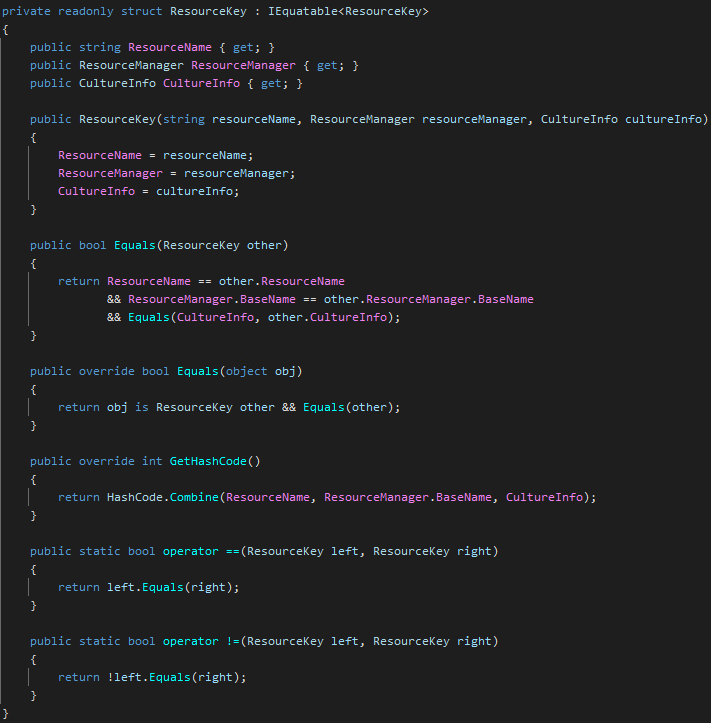
What I do in these cases is to create an own key type:
There are quite few nuances in this code.
First, it is struct and not class. It means it will be allocated on the stack when used as a local variable if we can avoid boxing it to the heap (this is important to keep in mind).
Second, it is readonly. We cannot exploit the in parameter modifier to avoid copying the struct, but at least we explicitly express our design intent that this is an immutable type. This is extremely important, because we want to use it as a key in a hash-based collection. A mutable key is a recipe for the disaster because the collection might not find an existing element. It is very bizarre to debug such a code which seemingly shows a bogus dictionary.
We want to implement custom equality. We compare resource names by ordinal comparison, which is the fastest out of all string comparisons. We don’t have to support natural language semantics, and we don’t expect variations in casing.
The ResourceManager is a harder problem. It does not support custom equality, so we have to find a key to it. It would be nice to find some quickly hashable value which uniquely identifies a ResourceManager instance like a number, but there is no such one. BaseName is the closest one I have found.
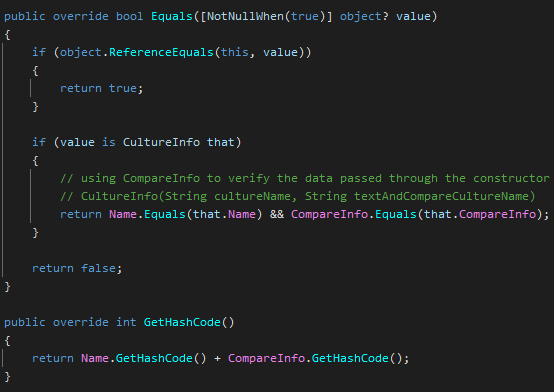
The last key part is CultureInfo. Fortunately, CultureInfo supports equality:
But there are more things about Equality. For parameter passing without boxing we have to implement the generic IEquatable, and create a strongly typed Equals. For hash table support we have to implement GetHashCode in tandem with the Equals. Again if the two code are not in sync, hash tables won’t find a value based on your key. Trust me, I saw this strange phenomenon many times.
Overloading the operators is not necessarily needed based on the usage I planned, but nonetheless it is a good practice to implement them. The good news, Resharper will generate the whole equality code for you. However, it does not consider which member implements equality and which one does not. So, it generates this code:
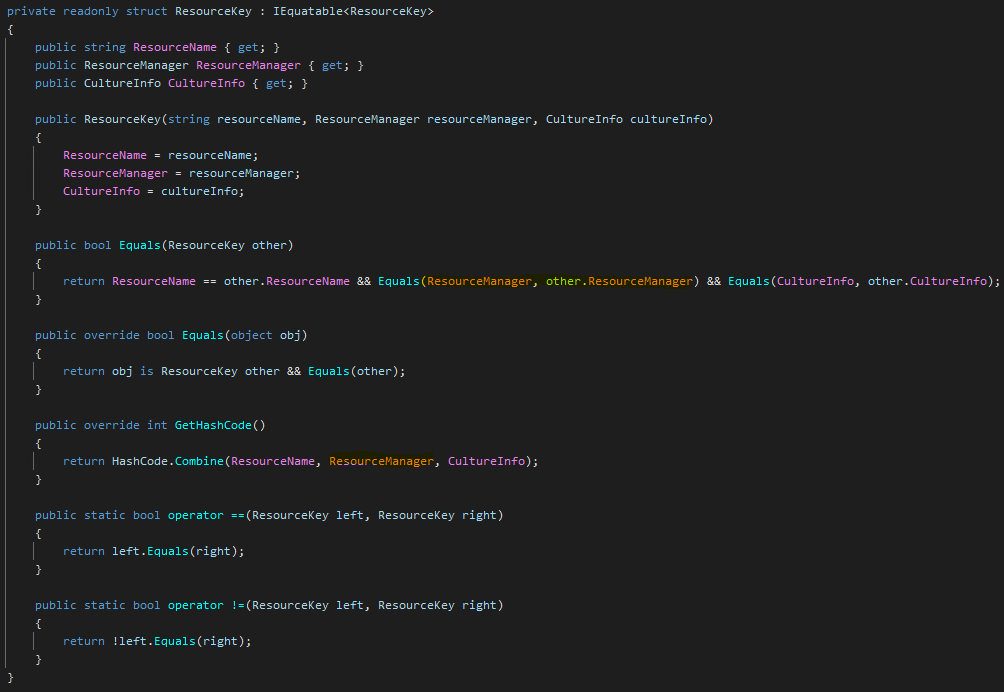
It is very similar to the proper code you saw earlier, but there is a crucial difference: the generated code compares and hashes the ResourceManager instance itself. We already know this won’t work properly. So, we have to replace ResourceManager references to ResourceManager.BaseName.
As you can imagine, I rewrote the Equals method, but forget about GetHashCode. What happened? ConcurrentCollection did not find the key it already stored. Learn from my mistake.
Ok, now that we have discussed every detail of this key struct, it’s time to use it:
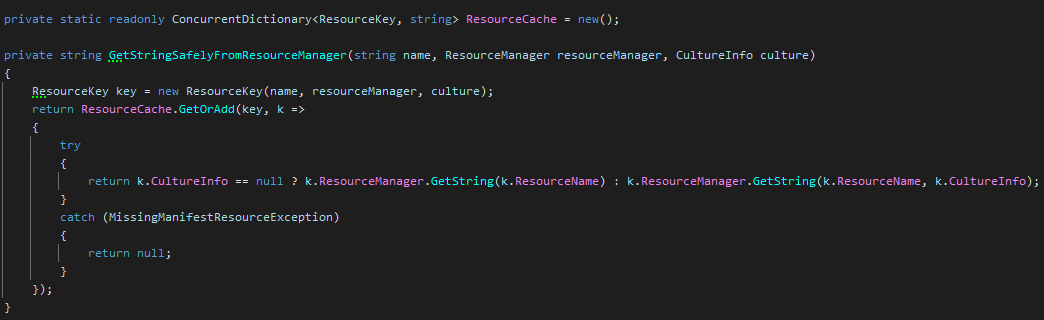
The 3 amigos passed to the original GetStringSafelyFromResourcemanager. I embed them to the ResourceKey struct. No heap allocation here. ConcurrentCollection will find the already cached item by the key, or create it by calling the original code inside the try statement.
ConcurrentCollection is generic, so the key won’t be boxed and unboxed, it will be copied when passed to the GetOrAdd method. If the key would be a class, the parameter passing would copy 8 bytes (this is a 64 bit code). Our key struct contains 3 references, so the sum size of it is 24 bytes (barring memory alignments, but 3 8 bytes references generally won’t need custom alignment). So, passing the key to GetOrAdd needs 24 bytes memory copy, while a class key would need 8 bytes. This is a small performance penalty in change of no heap allocation. If the performance is not satisfactory and we have more time, we could switch to class implementation and measure things again. However, my clients don’t pay for playing with the code, they want quick results, so I don’t have time to play around with every idea I come up with IF the code became fast enough. (However, I play a lot such fine tuning on my own pet code in my spare time.)
Why is try-catch needed? The resource manager of this application was a bit unusual. The customer built a clever resource name lookup strategy, where ViewModels are marked with a custom attribute which specifies the resource class for the ViewModel. Because ViewModels can be derived, the resource name lookup code traverse the inheritance chain to find the resource name. During traversal N-1 resource class won’t contain the requested resource, only 1 does. Strange enough, the .NET ResourceManager class does not have a TryGetValueByKey-like api, so you cannot query the existence of a key without an exception for missing keys.
So, oddly, the exception is very much expected knowing this logic. We know exceptions are very expensive in .NET, so even though we don’t like the fact that the ResourceManager API is created in this way, we have to live with it.
When the key is not found in a particular ResourceManager we catch the exception and return null, so we can memoise (cache) the fact there is no value for this resource key.
The first version of this resource cache was different, because the missing key case was handled by the original code of the customer. When I measured the cache enhanced code I was frustrated because there was almost no performance gain. I’m telling this, because you have to know performance tuning is not a strictly linear process, there are setbacks and sometimes you have to rollback the code because a change did not yield the expected gain – just made the code more complex.
There was another observation, that the code running under debugger was much slower than running outside the debugger. The debugger slows down the running code, but this was way more than it usually does. In Visual Studio you would see scrolling lines in the Debug Output Window informing you that tons of exception are thrown and handled, but I did not see this in Jetbrains Rider (this customer uses Rider instead of VS). But when you see a code much-much slower in debugger you can suspect it directly logs a lot to the output window, or it throws many exceptions.
The final code in the previous picture properly caches the fact a key has no value, so it throws and swallows exception only once for each missing key. So, after the frequently used keys are cached, no more exceptions were thrown and swallowed.
Here are the measured durations after proper resource caching:
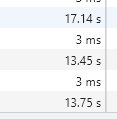
Now, this is impressive! From 30 seconds we optimized the code to 13.5 seconds! (17.14 sec is the duration of the cold start.)
Actually, we could call it a day, and stop the optimization. But I generally stop when there are no more low hanging fruits. We feel there are not many inefficiencies remaining in the code, but remember, we didn’t expect the resource lookup to be so slow, so it worth to measure the code once again.
The previously optimized ResourceLocalizer code now takes 34 ms instead of the original 14800ms. This is a gain by a factor of 460. There is no point working on this area any more.

The big picture reveals that the data access code is responsible for only 7% of the total server side execution time, while the actual pdf generation takes up the remaining 93%:

Is there any easy optimization target yet? By drilling down we might find some:
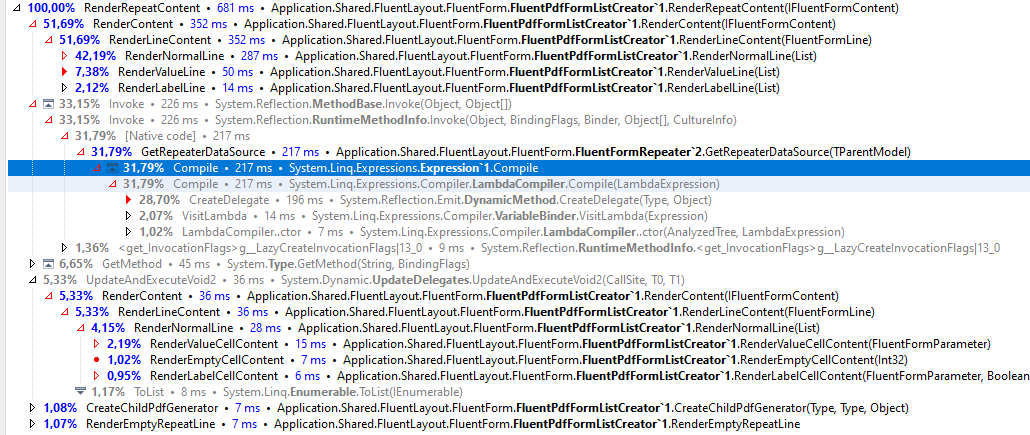
The GetRepeaterDataSource contains a code which use some Lambda Expression magic for the fluent report declaration syntax I have shown earlier. To access the real data behind the Expression it has to be compiled to CIL code. It might be avoidable to compile it more than once, so this 200ms cost can be eliminated for further runs. Despite the fact I wrote this code I did not spend more time optimizing it further – there is a room for improvement in the future.
There is one more code which can be optimized:
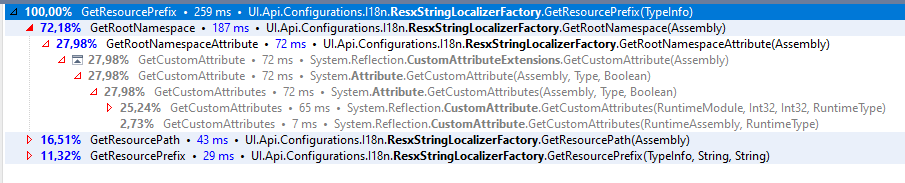
This code is called before the Resource lookup I detailed earlier. A prefix is calculated based on custom attributes and assembly info – slow reflection code. This prefix can be cached in the same manner as the resource values. So, I added a simple cache in front of it using ConcurrentCollection again.
After this small optimization the final numbers are here:

You can see it is only slightly better than the previous one. The diminishing return effect is very typical during optimization. I grab the low hanging fruits first, and I stop the optimization when I reach a barrier which is hard to push through – if the performance numbers are acceptable. If they are not, a much more expensive redesign is needed. Or, we rewrite the requirements. A good example is the reporting system of the Interactive Brokers. If I want to generate a transaction report for a short period, they generate it immediately. But for larger reports they send it to a background process, and notify me when the results completed.
Here are some updates I wrote after I finished this article.
The release version is a bit faster as expected:

Line-by-line profiling reveals that most of the time is now spent in the iTextSharp component:
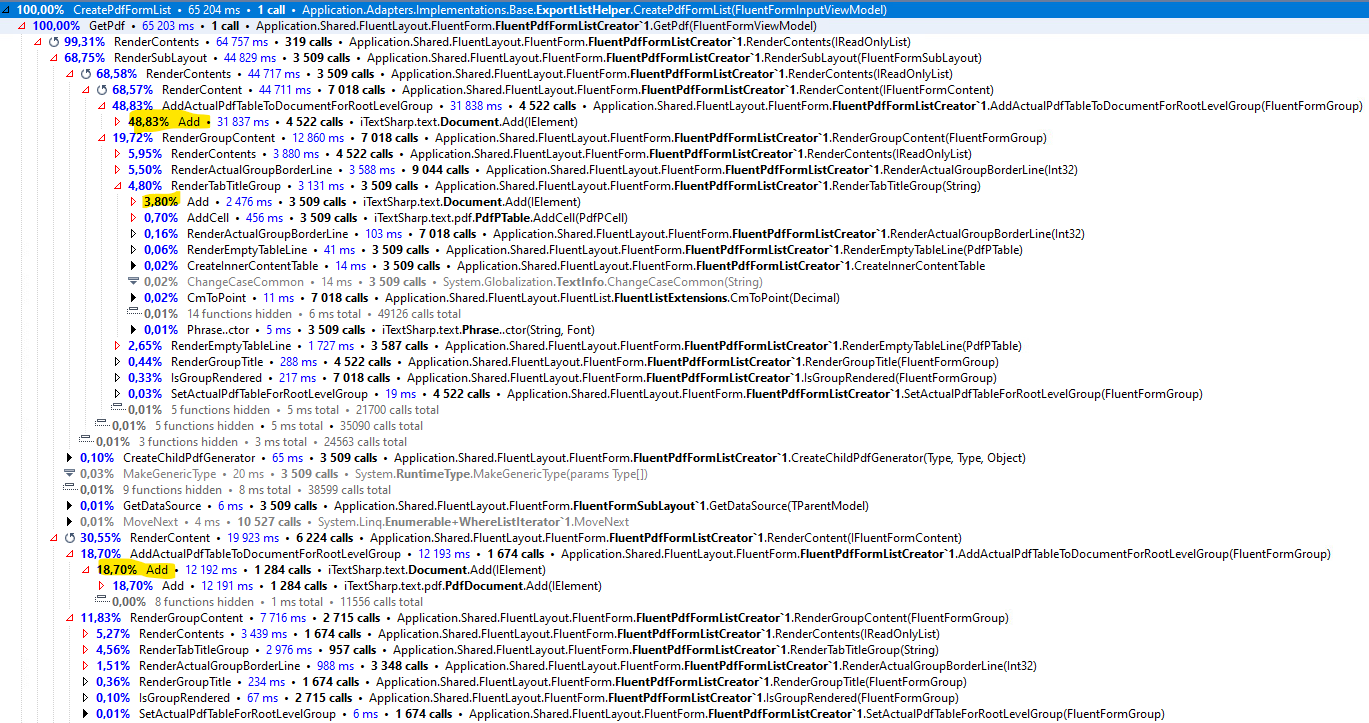
The measured duration is 65sec, this is caused by the overhead of the profiler. If we merge all Document.Add calls we can see 47 sec from 65 sec is spent inside the pdf library Add method (there are other call to this library):

We see 10722 cells added to the report, this is the main source of the generation cost.
If we group the running time by assembly we see the following:
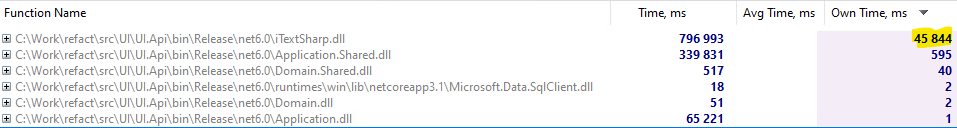
It is clear, that time spent in iTextSharp is 2 orders of magnitude larger than the own time of the caller application code, so optimizing the application code further is futile.
But, not all hope is lost. Sometimes, we can change how we drive an external library, so we can optimize the code indirectly. I’ll show an example of this in a later installment.
The last possibility is to completely replace the pdf generator component to a new one, but this is more expensive option because the APIs of the components won’t be the same so the application code should be modified significantly.
Final words
We started with 42 seconds execution time for 319 items. The final code delivers the same 1380 pages report in 13 seconds. The optimized code 3.23x faster than the original one. And it loads the the database much more lightly. It consumes less CPU, so the business becomes cleaner, the CO2 footprint will be lower. Everybody is happy.
How much time was needed for this optimization? 3 days.
Could you hire me? Contact me if you like what I’ve done in this article and think I can create value for your company with my skills.
LEAVE A COMMENT
6 COMMENTS
Hát igen… Ez szép volt !
Sokan nem gondolnak a bufferelésre. Vagy ha igen, akkor meg arra nem gondolnak, hogy mikor kell belőle kivenni egy elemet, mert nem lesz már rá szükség (vagy legalábbis eléggé kis eséllyel lesz rá újra szükség), különben túl nagyra hízik és meghal tőle a gép.
Magam is sokszor optimalizáltam már céges környezetben pdf-be generlást. A kiindulóm olyan 60 sec/pdf volt, amiből első kanyarban nekem is 40-re sikerült levinni, majd onnan 3 sec-re ! :-)
Mostanában sikerült laptopon elérnem a 150 pdf/sec értéket sablonból kiindulva (igen, nem fordítva írtam. Tényleg ennyi pdf másodpercenként), és különböző változókkal (kép/szöveg) feltöltve. :-) Egy erősebb asztali gépen meg már az 1000 pdf/sec is átlépve. Persze itt már komoly i/o korlátok vannak ennek a mennyiségnek a lemezre írásában.
Milyen pdf library-t használsz? Mértem még egyet, kiegészítve a szöveget, ebből látszik, hogy itt az iTextSharpban megy el az idő 99%-a.
Nem ingyenes. Céges környezetben van és fizettek érte: Aspose csomag (https://www.aspose.com/).
Az MS-word-ből (sablon) pdf-be mentés borzasztó gyors tud lenni, persze nem az első pdf-nél, hanem az összes rákövetkezőnél, miután kicseréltük benne a változó-értékeket a következő küldeményhez.
Itt is volt először egy eléggé nagy fejvakarás, mert párhuzamosan nem tudott rendesen menni több szálon egyszerre. Mire megmértük mi is, és rájöttünk hogy a GC kavar bele, és ha a konfigba belekerül ez: , akkor szárnyra kap és párhuzamosan száguld mint az istennyila. :-)
Köszi, megnézzük.
Kimaradt a konfigos rész:
gcServer enabled=”true”
gcConcurrent enabled=”true”
Igen, a server GC kell a többszálú terheléshez a több heap miatt:
https://soci.hu/blog/index.php/2009/06/11/a-tobbszalu-skalazas-nehezsegei/