This was a very bizarre case.
An SQL Server instance unpredictably and suddenly ate all memory of the server and even more till the administrator could not log in to the machine via RDP. The server had 8, later than 16G RAM; however, SQL Server consumed 50GB. It was a development server; that is why it has such a relatively small amount of memory.
When the problem showed up in its ugly rear, the only mitigation was to restart the computer.
Please note that for clarity, the events described in the article do not appear in the same order as the actual events that occurred in real life.
I suggested turning on lock pages in memory – this was just a simple change without much thought. I hoped that it might improve things. It did not.
I have created an SQL script that used sys.dm_os_memory_clerks DMV to query the current state of the memory. I inserted the output of this DMV into a table. An SQL Server Agent job ran this script every minute to see the historical memory usage details. The collected rows look like this:

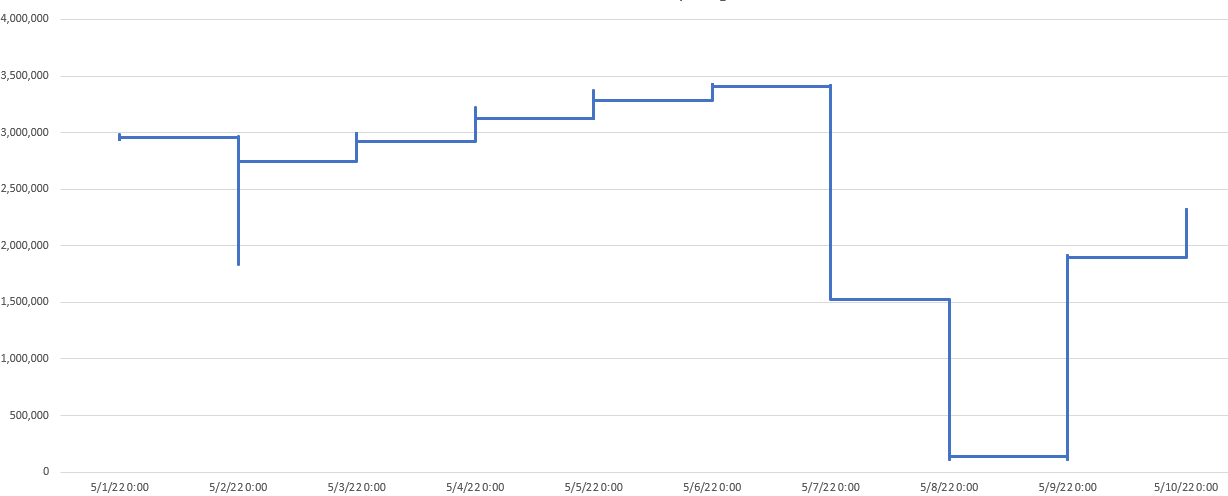
There was no sign of excessive memory usage at all! I charted the sum memory of each sample per minute, and you see the memory usage dropped instead of went up before the server died (on 05/07):

I asked the client not to restart the machine immediately when the error happens next time; ping me, and I’ll try to diagnose it directly.
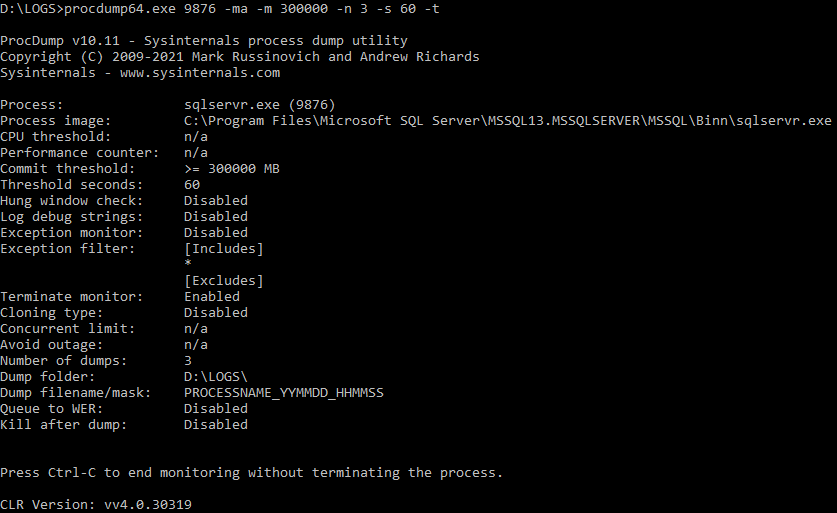
I also started a ProcDump session to create a memory dump of the SQL Server when the memory inflation happens again. But ProcDump itself crashed because of Out of Memory. How ironic. :)

Some days later, the error came up again. Because I could not log in to the machine, I used Sysinternals command-line tools to monitor the bogus machine’s processes remotely.
I used PsList to list the running processes remotely.

It’s interesting to see that according to this tool, the memory usage of the SQL Server is 2,163,224 bytes, i.e., 2GB. This memory size discrepancy was unexplainable at that moment. But I could not log in to the machine via RDP, which indicated the out-of-memory condition.
I picked some non-essential processes (SQLAGENT, …) and killed them by PsKill remotely. I killed as many processes as I needed to be able to log in via Remote Desktop.
Once I was in, I started Task Manager and Resource Monitor, and I saw that the memory usage was really huge, 45 GB. I tried to create a memory dump by the Task Manager, but it failed because it wanted to save the dump to the system partition, and that partition did not have enough free space to store the 39GB dump. Therefore, I created a dump by ProcDump to another drive.
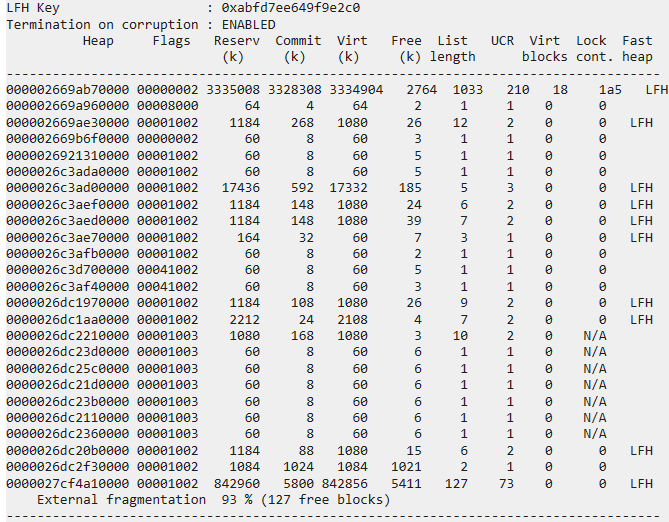
I loaded the dump to Win Debug on my development machine and checked the heaps. What is interesting is that WinDbg needed about an hour to index the dump. Here is how the native heaps looked:

Everything seemed ok; SQL Server used about 3.4GB of memory. But why the dump size was 39GB, and why did the monitoring tools report such extensive memory usage?
DebugDiag summary section shed light on it:

Now, this is interesting! SQL Server Committed 37.88GB memory. It means it really reserved AND committed that amount of virtual memory from Windows. Windows had to create a backing store for it, i.e., it allocated a big chunk in the pagefile.sys.
But we saw the memory in heaps is just 3.x GB. DebugDiag confirms this fact:

It reports 4.05GB. What does this mean? Well, hard to tell. I can think about some bogus component called VirtualAlloc Windows API directly. I doubt SQL Server does it; this would be a trivial memory leak.
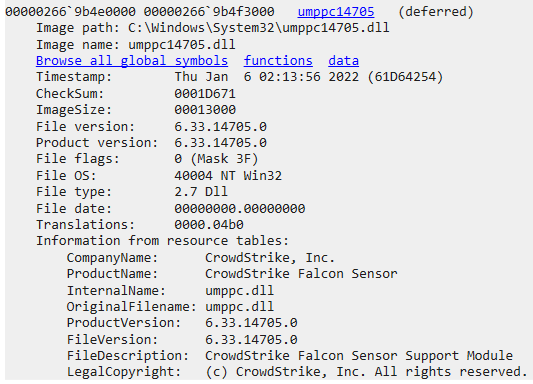
The memory dump contained an interesting 3rd party component:

Can we blame this component for all the trouble? I’ll tell you in the second part. :)
Could you hire me? Contact me if you like what I’ve done in this article and think I can create value for your company with my skills.
LEAVE A COMMENT
2 COMMENTS
Útállak ! :-)
Amúgy: https://community.spiceworks.com/topic/2351789-issues-with-crowdstrike-falcon